Key Takeaways
- An out-of-service rate is the share of roadside inspections that result in a vehicle or driver being placed out of service, calculated as OOS inspections divided by total inspections.
- CVSA’s 2026 International Roadcheck recorded a 19.0% vehicle out-of-service rate and a 5.8% driver out-of-service rate across 54,575 inspections.
- The national vehicle out-of-service rate has moved between roughly 16.5% and 23% across the past nine completed Roadcheck events, according to CVSA’s year-by-year results.
- During the 2026 Roadcheck, brake-related defects led vehicle OOS findings, while no medical card and hours-of-service violations led driver OOS findings.
- A vehicle that passes a Level I or Level V inspection without a critical violation earns a CVSA decal, valid for up to three months, which generally exempts it from reinspection during that window.
- Out-of-service violations carry higher severity weight in FMCSA’s Safety Measurement System than non-OOS findings, meaning a single OOS event can affect your carrier profile more than a routine citation.
- False records of duty status accounted for 266 driver out-of-service violations during the 2026 Roadcheck, or 6.7% of driver OOS violations recorded by CVSA.
| Table of contents |
|---|
| What the Rate Means |
| How It Is Calculated |
| The National Benchmark |
| Your 2026 Target |
| What Drives It Up |
| CSA and Insurance Impact |
| Year Over Year Trend |
| Questions to Ask |
| Quick Answers |
Introduction
A roadside inspection either ends with your truck back on the road in a few minutes or with a driver sitting at a weigh station waiting on a repair, a tow, or a call to dispatch. The difference between those two outcomes, repeated across every inspection your fleet goes through in a year, is what shows up as your out-of-service rate. It is one of the few numbers that tells you, without any guesswork, how your fleet actually performs when an inspector is standing at the door of the cab.
Most fleet owners know the phrase out-of-service order from the moment it happens to them. Fewer track it as a rate they can measure and improve over time. That gap matters, because your out-of-service rate is not just a compliance statistic. It follows your carrier into FMCSA’s Safety Measurement System, and it shapes how insurance underwriters price your risk long before a bad inspection ever becomes a pattern.
Here is what the rate actually means, how it is calculated, and where the national benchmark has landed over the past several Roadcheck cycles. You will also see a realistic target for a small or mid-sized fleet in 2026, what tends to drive the number up, and how it connects to your CSA score and your insurance costs.
If you want to see what a registered setup costs for your fleet size while you read through this, our price calculator gives you that number in a couple of minutes.
What Is an Out-of-Service Rate?
An out-of-service rate is the percentage of roadside inspections that result in a vehicle, a driver, or both being pulled from service until a violation is corrected. It is a measurement of outcomes, not just a count of violations, since a truck can rack up several citations at an inspection without ever being placed out of service.
The rate applies at two levels. CVSA publishes a national rate each year based on its International Roadcheck event, which gives the industry a benchmark to compare against. Your own fleet also has its own rate, built from every roadside inspection your trucks go through across the year, not just the ones that happen during a named enforcement event. That second number is the one that actually reflects your operation.
A vehicle out-of-service violation means a critical vehicle condition, such as a serious brake, tire, lighting, or cargo-securement defect, that must be corrected before the vehicle can continue. A driver out-of-service violation restricts the driver from operating, such as when the driver exceeds an hours-of-service limit, lacks required credentials, or has a disqualifying record-of-duty-status violation. Both count toward the rate separately, and both carry consequences for your carrier’s compliance profile.
How Is Your Fleet’s Out-of-Service Rate Calculated?
Your fleet’s out-of-service rate is the number of inspections that resulted in an out-of-service order divided by the total number of inspections your trucks and drivers went through over a given period. If your fleet had 40 inspections in a year and 4 resulted in an out-of-service order, your rate is 10%.
This is a lagging metric, meaning it only reflects inspections that already happened. That is exactly why tracking it matters. A fleet that reviews its inspection history regularly can spot a pattern, such as the same defect showing up across multiple trucks or the same driver getting flagged more than once, before that pattern turns into a larger compliance problem.
Your inspection history is available through FMCSA’s public systems and through your own carrier records. A registered ELD platform makes this easier to track because your logs, your DVIR history, and your inspection outcomes live in one place instead of being scattered across paper files and separate systems. We provide a management portal that keeps your compliance records organized in one view, which is the starting point for actually calculating and tracking this number over time. You can see how our ELD platform and hardware supports that kind of ongoing recordkeeping.
What Was the National Out-of-Service Rate in the Most Recent Completed Roadcheck?
The most recently completed CVSA International Roadcheck, held May 12-14, 2026, included 54,575 inspections across North America. CVSA reported that 10,350 commercial motor vehicles, or 19.0%, and 3,184 drivers, or 5.8%, were placed out of service.
That means roughly one in five vehicles inspected during the three-day event was pulled from service, and about one in seventeen drivers. CVSA runs Roadcheck as a concentrated 72-hour inspection blitz, so its results tend to run somewhat higher than the average rate a typical carrier sees across a full year of routine inspections, since enforcement staffing and inspection intensity are elevated during the event.
ELD tampering, falsification, or manipulation was the 2026 driver focus area, and cargo securement was the vehicle focus area. CVSA reported 146 driver OOS orders for ELD tampering and 1,724 cargo-securement OOS violations. See CVSA’s 2026 International Roadcheck results for the complete data.
What Out-of-Service Rate Should Your Fleet Be Aiming For in 2026?
FMCSA does not set one universal target out-of-service rate for every fleet. Use the 2026 Roadcheck rates of 19.0% for vehicles and 5.8% for drivers as external benchmarks, then set separate internal targets that improve on your own baseline and account for inspection volume. The long-term objective is to prevent every avoidable OOS event, not merely to stay below the national average.
The national Roadcheck number is a useful reference point, but it is not the number to be satisfied with. It reflects the industry as a whole, including carriers with no organized inspection or maintenance program at all. A fleet running a registered ELD and a documented DVIR process has the tools to sit well below that average rather than near it.
One practical marker to track alongside your rate is how often your trucks earn a CVSA decal, issued when a vehicle passes a Level I or Level V inspection without a critical violation. A decal is valid for up to three months and generally exempts the vehicle from reinspection during that window, which is a useful proxy for whether your inspection outcomes are trending in the right direction.
If your current rate is running at or above the national average, that is a signal to look at where the failures are concentrated, whether that is a specific truck, a specific driver, or a specific violation category, rather than treating every inspection as an isolated event.

What Drives Your Fleet’s Out-of-Service Rate Up?
The two biggest drivers of a fleet’s out-of-service rate are unresolved vehicle defects and gaps in driver compliance documentation, and both are largely preventable with consistent daily habits rather than reactive fixes.
On the vehicle side, brake system issues have led national out-of-service findings in nearly every recent Roadcheck cycle, regardless of what CVSA’s named focus area was for that year. A defect that a driver notes on a DVIR but that never gets repaired or documented is the most common way a known problem turns into a roadside out-of-service order weeks later. Connecting your DVIR process directly to your maintenance workflow closes that gap, since a defect logged by the driver creates a repair record immediately instead of sitting in a folder. Our article on how ELD and DVIR data work together covers this connection in more detail.
On the driver side, hours-of-service violations and records of duty status issues are consistently among the top driver out-of-service categories. In the 2026 Roadcheck results, no medical card and hours-of-service violations were the two leading driver OOS categories, while false records of duty status accounted for 266 driver OOS violations. A properly used, registered ELD records driving time automatically, but carriers still need accurate driver profiles, log review, training, and controls against improper edits or tampering.
During the 2026 event, CVSA’s ELD-tampering and cargo-securement focus did not replace the standard inspection process. Inspectors still evaluated the full set of driver requirements and vehicle components applicable to each inspection level.
How Does Your Out-of-Service Rate Affect Your CSA Score and Insurance Costs?
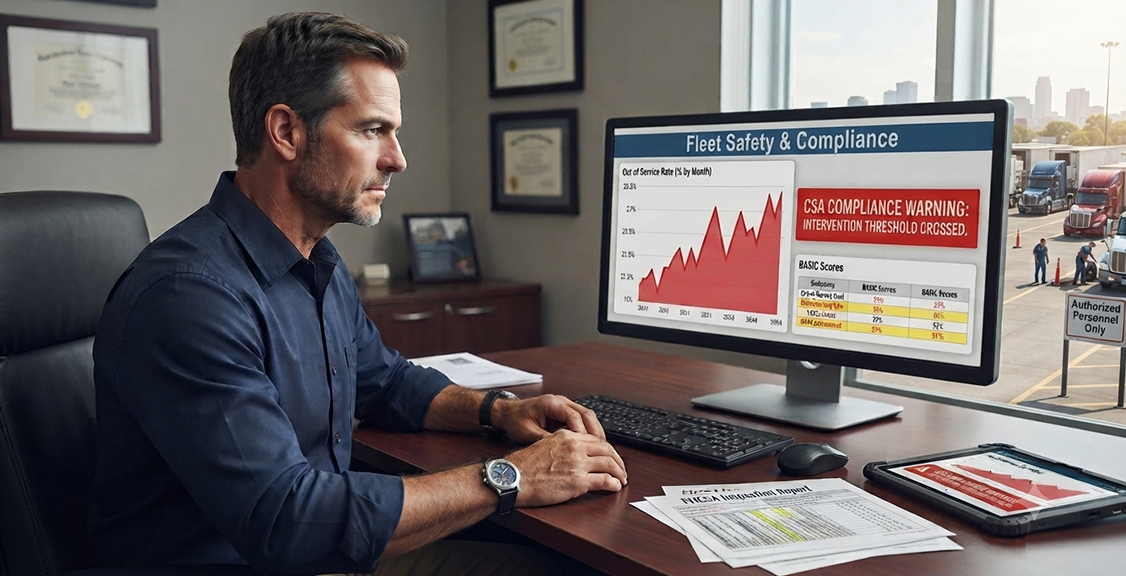
In FMCSA’s Safety Measurement System, a violation that results in an out-of-service order receives an additional OOS severity weight of 2. That added weight can make OOS findings more consequential than otherwise similar non-OOS violations within the same BASIC.
FMCSA’s Safety Measurement System tracks violations across a rolling window and weighs more recent and more severe findings more heavily. A pattern of out-of-service events, even across different trucks or drivers, can raise a carrier’s BASIC measures and percentiles more quickly than comparable non-OOS findings. Elevated BASIC results can increase the likelihood of an FMCSA intervention; they do not automatically guarantee a compliance review. Our article on how ELD violations affect your compliance record walks through how that scoring works in practice.
Insurance underwriters also review a carrier’s inspection and out-of-service history when setting premiums. A clean inspection record with a low out-of-service rate is a materially better risk profile than a record showing repeated OOS events, even if the total number of citations looks similar on paper. That connection is not always obvious to a fleet owner focused only on avoiding the immediate fine, but it shows up clearly at renewal time.
How Has the National Out-of-Service Rate Changed Over Time?
The table below shows CVSA’s published vehicle and driver out-of-service rates from each completed International Roadcheck over the past several years, giving your fleet a multi-year reference point rather than a single snapshot.
| Roadcheck Year | Total Inspections | Vehicle OOS Rate | Driver OOS Rate |
|---|---|---|---|
| 2018 | 67,603 | 21.6% | 3.9% |
| 2019 | 67,072 | 17.9% | 4.2% |
| 2020 | 50,000+ | 20.9% | Not separately reported |
| 2021 | 40,000+ | 16.5% | 5.3% |
| 2022 | 59,026 | 21.1% | 6.3% |
| 2023 | 59,429 | 19.0% | 5.5% |
| 2024 | 48,761 | 23.0% | 4.8% |
| 2025 | 56,178 | 18.1% | 5.9% |
| 2026 | 54,575 | 19.0% | 5.8% |
These figures come from CVSA’s International Roadcheck results, which the organization publishes after each year’s event.
The national vehicle rate has moved within a fairly narrow band, roughly 16.5% to 23%, across every year in this table. There is no clear year-over-year downward trend, which is a useful reminder that the industry average is not steadily improving on its own. A fleet aiming to stay meaningfully below this range needs its own process, not general industry momentum.
What Questions Should You Ask to Lower Your Fleet’s Out-of-Service Rate?
Do we currently know our fleet’s out-of-service rate?
If you cannot answer this with a number, start by pulling your inspection history and calculating it. Most fleet owners can name their last citation but cannot say what percentage of their inspections actually ended in an out-of-service order. You cannot improve a metric you are not tracking.
Are our DVIR defects actually getting repaired and documented?
A defect noted on a form that never reaches the shop is the most common gap between a known issue and a roadside out-of-service order. Pull a sample of recent DVIRs and check whether each reported defect has a matching repair record with a date and a signature. If that trail is missing or inconsistent, the paperwork is not doing its job even if the driver is filling it out correctly.
Is our ELD device currently on the FMCSA-registered list?
A device that was compliant at purchase can later be removed from FMCSA’s registered list. If that happens, follow the replacement deadline in FMCSA’s notice, use the permitted temporary logging method, and move to a compliant device before the deadline. After the transition period, continued use of the revoked device may be cited under 49 CFR 395.8(a)(1) and can place the driver out of service.
Do our drivers understand what triggers a driver-side out-of-service order?
Hours-of-service limits, missing medical certificates, and record of duty status gaps are common and largely preventable with basic awareness. A short refresher covering these specific triggers, rather than a general compliance overview, tends to close this gap faster. Ask your drivers directly whether they know what a driver-side out-of-service order actually looks like before assuming they do.
Are we tracking which trucks or drivers are generating repeat violations?
A pattern concentrated in one vehicle or one driver points to a specific fix, such as a mechanical issue that keeps recurring or a driver who needs targeted coaching, rather than a fleet-wide problem. Without tracking this by truck and by driver, a repeat issue can look like random bad luck instead of a fixable pattern. Reviewing inspection outcomes at that level of detail is what turns raw numbers into a corrective plan.
How quickly do we act on a defect once it is reported?
The gap between a driver noting an issue and a shop resolving it is where most preventable out-of-service events originate. Measure this gap in days, not just whether the repair eventually happened. A defect that sits unresolved for two weeks carries real roadside risk the entire time it goes unaddressed.
Do we know our current standing in FMCSA’s Safety Measurement System?
Reviewing your BASIC percentiles periodically catches a rising trend before it reaches an intervention threshold. A score that looks fine today can move quickly after just a few out-of-service events, since those carry more weight than routine citations. Checking this quarterly, rather than only after a bad inspection, gives you time to react before a compliance review becomes likely.
If you have questions about how your current setup tracks this data, our support team can walk through what your inspection history shows and where the gaps are.
Common Questions About Out-of-Service Rates
About Out-of-Service Rates and Roadside Inspections
What counts as an out-of-service violation?
A vehicle out-of-service violation is a critical vehicle condition, such as a serious brake, tire, lighting, or cargo-securement defect. A driver out-of-service violation may involve an hours-of-service limit, a missing medical certificate, an invalid or missing required license, or a disqualifying record-of-duty-status violation.
Is the national out-of-service rate the same every year?
No. Across the nine completed Roadcheck events from 2018 through 2026, the national vehicle rate ranged from about 16.5% to 23%, without a consistent year-over-year trend.
How is my fleet’s out-of-service rate different from the CVSA Roadcheck rate?
CVSA’s published rate reflects a single 72-hour enforcement event each year. Your fleet’s own rate should be calculated from every roadside inspection your trucks go through across a full year, which gives a more complete picture of your actual performance.
What is a CVSA decal and how does it relate to this metric?
A CVSA decal is issued when a vehicle passes a Level I or Level V inspection without a critical violation. It is valid for up to three months and generally exempts the vehicle from reinspection during that window, making it a useful positive indicator alongside your out-of-service rate.
Does an out-of-service order always mean a fine?
Not always. An out-of-service order stops the vehicle or driver from continuing until the violation is corrected, which is separate from any civil penalty that may also be issued depending on the violation type and severity.
About Lowering Your Fleet’s Out-of-Service Rate
What is the single biggest factor in lowering our rate?
A documented process that catches problems before roadside, rather than reacting after an inspection flags them. Fleets that connect DVIR reporting directly to repair tracking, and that record hours of service automatically instead of by hand, see fewer surprises at the weigh station than fleets relying on manual paperwork.
Can a registered ELD actually lower our out-of-service rate?
A registered, properly functioning ELD reduces the record of duty status and falsification-related violations that are among the most common driver out-of-service categories. It does not address vehicle mechanical issues on its own, which is why pairing it with a documented DVIR and maintenance process matters.
How often should we review our inspection history?
Reviewing it at least monthly lets you catch a pattern, such as repeat violations tied to one truck or one driver, early enough to correct it before it affects your CSA score.
Does our fleet size change what target we should aim for?
The national benchmark does not change with fleet size, but your internal target and interpretation should account for inspection volume. One out-of-service event has a much larger statistical effect when a fleet has only a few inspections.
What role does driver training play in this number?
A driver who understands what triggers a driver-side out-of-service order, such as an hours-of-service limit or a documentation gap, is less likely to generate one. Training is a direct, low-cost way to reduce driver-side findings.
How does Geosavi support tracking this over time?
We provide an online management portal that keeps your ELD logs, duty status records, and inspection-relevant data organized in one place, so pulling your inspection history and calculating your rate does not require digging through separate paper and digital systems.
Where can I find more compliance-focused reading on related topics?
Our blog covers HOS compliance, DVIR integration, and CSA scoring topics that connect directly to out-of-service risk.
Conclusion
Your out-of-service rate is one of the most honest numbers your fleet has. It is not based on self-reported data or internal estimates. It reflects what an inspector actually found, at the roadside, on your trucks and with your drivers. The national benchmark from the 2026 Roadcheck was 19.0% for vehicles and 5.8% for drivers, and the vehicle rate has remained within a fairly narrow range for close to a decade without a steady downward trend.
Treating this as a number to track, not just a bad outcome to react to, is what separates fleets that improve over time from fleets that stay stuck near the national average. A registered ELD, a documented DVIR and maintenance process, and regular review of your own inspection history are the practical levers that move this metric, working together rather than as separate fixes.
We are an FMCSA-registered ELD platform based in Tucson, Arizona, and we back every device with 24-hour, 7-day support and a 30-day money-back guarantee. If any of this raises questions about your specific fleet, reach out to our team or call our support team at (800) 261-4361 and we will walk through your inspection history together.